Sustainable development goals
Introduction
The UN Sustainable Development Goals (SDG) have set out a vision for a future global society based on sustainability principles. The 17 goals and 169 targets of the SDG agenda cover the ecological, economic and social dimensions of sustainability. These goals and targets provide principles and a reference for national and local policy. Companies are encouraged to commit for an improvement of the production processes’ sustainability and policy makers at all levels are asked to align their strategies to the sustainable development principles of the Agenda.
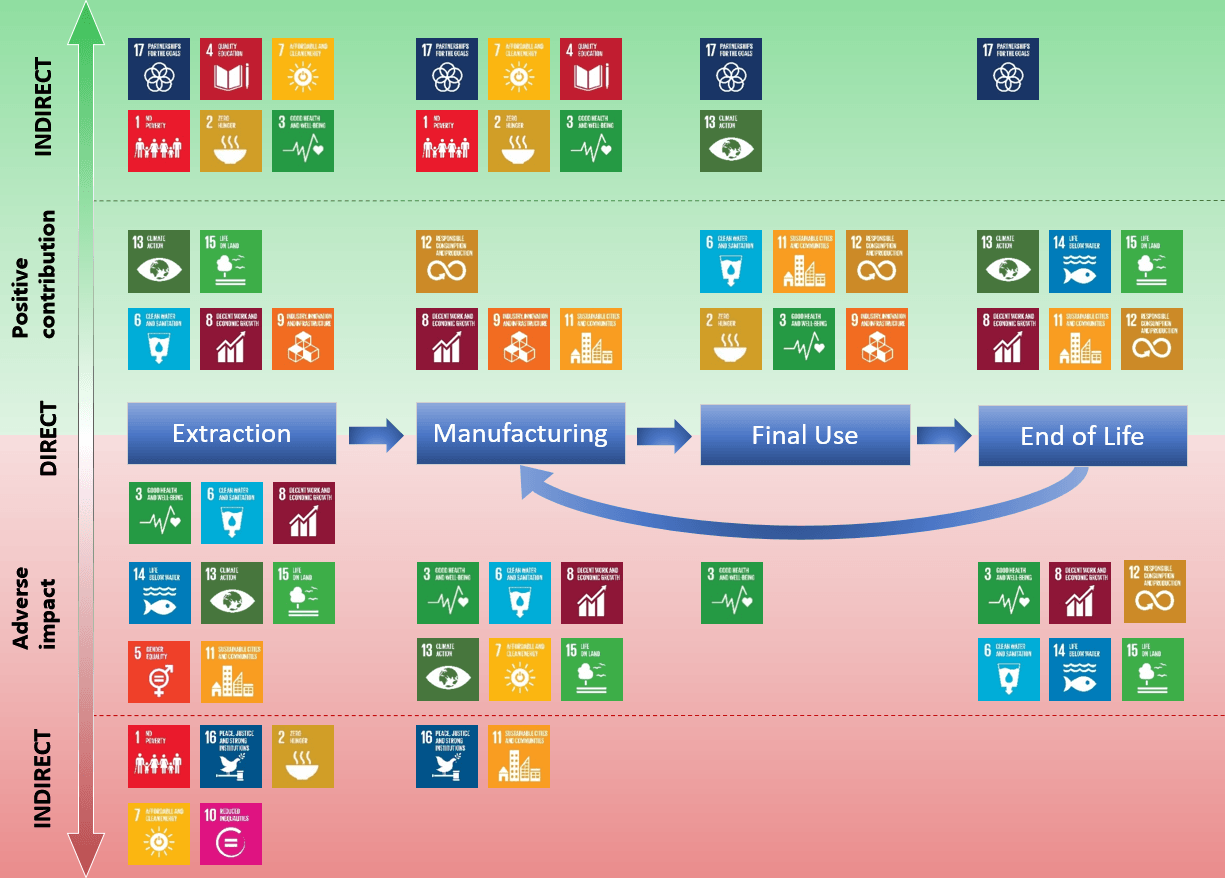
The UN SDGs framework does not include an explicit goal on raw materials, as raw materials can have an influence, directly or indirectly, to all goals. The figure below highlights the potential contribution of raw materials to different SDGs along the value chain, from extraction to manufacturing, use and end-of-life. Often, both positive and negative outcomes for the same goal are possible.
The information presented in this section on SDGs and raw materials is based on the JRC report “Mapping the role of Raw Materials in Sustainable Development Goals. A preliminary analysis of links, monitoring indicators and related policy initiatives” by Mancini et al.
Extractive phase
- Mining and quarrying: extraction of stone or other materials from a quarry, and extraction of valuable minerals or other geological materials from the earth (usually from an ore body, lode, vein, seam, reef or placer deposits).
- Forestry: here referring to the production of goods from forests, through silviculture and logging.
Manufacturing phase
- Non-metallic minerals, used, e.g. for construction (e.g. cement, concrete, glass, aggregates, etc.); as fertilizers (phosphate, nitrogen, etc.); or for ornamental scopes (e.g. marble, etc.).
- Metal production, encompassing the activities of smelting or refining ferrous, non-ferrous, and precious metals from ore or scrap, using metallurgic techniques. It also includes the production of metal alloys and super-alloys by adding certain chemical elements to pure metals.
- Wood and wood products manufacturing, including the first processing stages of sawmilling and planing of wood and the downstream activity of manufacturing of products of wood, cork, straw and plaiting materials.
- Paper and paper products manufacturing, comprising activities using wood as raw material to produce pulp, paper, paperboard and other cellulose-based products.
- Other industries processing biotic materials like natural rubber.
Use phase
Raw materials, in the form of semi-finished products and components, are supplied to downstream industries to manufacture final goods and services for consumers. Products incorporate a large variety of raw materials that in some cases (e.g. in electronics) are not even visible to the consumers. In this analysis, we refer to the final use of products containing abiotic or biotic raw materials.
End-of-Life phase
This phase includes different activities before the final product disposal, i.e. waste collection, energy recovery and recycling. However, waste flows occur also in previous steps of the supply chain (e.g. extractive waste).
End poverty in all its forms everywhere 
Cross-cutting Issues
- Raw materials sectors can be a stimulus to local economy, creating employment and increasing population income and business opportunities (also in other sectors).
Mining Sector
- The role of the mining sector in creating wealth and prosperity has been extensively studied in literature, as reflected in the scholarly debate on the “resource curse” theory. The “resource curse” is based on the observation that some countries rich in natural resources tend to grow more slowly than resource-poor countries (Mikesell, 1997; Anderson, 1998; Sachs and Warner, 2001). The resource curse hypothesis has been widely analysed and empirically tested both in developing and developed countries, with diverging conclusions arising from the literature. Some authors agree on the role of institutions and governance in determining the different outcomes (e.g., van der Ploeg, 2011; Mehlum et al., 2006).
- Mining projects can exacerbate land competition, For instance, especially in developing countries the limited access to land for the rural population can imply negative impacts on livelihood and consequent food insecurity, endangering wellbeing of local population and leading to their impoverishment. (e.g. Mancini&Sala 2018, Owen&Kemp 2015). [Indicator UN 1.4.2]
Monitoring indicators
- UN Framework:
- 4.2 Proportion of adult population with secure tenure rights to land, with legally recognized documentation and who perceive their rights as secure, by sex and by type of tenure
- Value added and jobs of the raw materials sectors (indicator 7 ‘Value added and jobs’)
- Goal 8 Decent work and economic growth
- Goal 2 Zero hunger
- Establishing a European Pillar of Social Rights COM(2017) 250 final
- Monitoring the implementation of the European Pillar of Social Rights COM(2018) 130
References:
- Anderson K. Are resource‐abundant economies disadvantaged? Aust J Agric Resour Econ. Wiley Online Library; 1998;42(1):1–23.
- Mancini L, Sala S. Social impact assessment in the mining sector: Review and comparison of indicators frameworks. Resour Policy. 2018.
- Mehlum H, Moene K, Torvik R. Institutions and the resource curse. Econ J. 2006;116(508).
- Mikesell RF. Explaining the resource curse, with special reference to mineral-exporting countries. Resour Policy. Elsevier; 1997;23(4):191–9.
- Owen JR, Kemp D. Mining-induced displacement and resettlement: a critical appraisal. J Clean Prod. 2015 Jan;87:478–88.
- Sachs JD, Warner AM. The curse of natural resources. Eur Econ Rev. Elsevier; 2001;45(4):827–38.
- van der Ploeg F. Natural Resources: Curse or Blessing? J Econ Lit. American Economic Association; 2011;49(2):366–420.
End hunger, achieve food security and improved nutrition and promote sustainable agriculture 
Mining and Manufacturing Sectors
- In the case of mining industry, competition with the agricultural sector for water and land resources and pollution of water bodies and farming land can affect food security. This is the case especially in local communities directly dependent on natural resources for their livelihood (e.g. Kitula 2006, Kumah 2006). [Indicator UN 2.4.1]
Use Phase
- The extractive sector and the processing industry supply materials used as fertilizers in agriculture, for instance phosphate and potash. Thus, fostering the agricultural productivity these sectors indirectly contribute to the food security goal. [Indicator UN 2.3.1]
Monitoring indicators
- UN Framework:
- 2.3.1 Volume of production per labor unit by classes of farming/pastoral/forestry enterprise size
- 2.4.1 Proportion of agricultural area under productive and sustainable agriculture
- Goal 1 No poverty
- Goal 6 Clean water and sanitation
- Goal 14 Life below water
- Goal 15 Life on land
- EU policy framework on food security COM(2010)127 final
- Common Agricultural Policy (CAP)
References:
- Kitula AGN. The environmental and socio-economic impacts of mining on local livelihoods in Tanzania: A case study of Geita District. J Clean Prod. 2006;14(3–4):405–14.
- Kumah A. Sustainability and gold mining in the developing world. J Clean Prod. 2006;14(3–4).
Ensure healthy lives and promote well-being for all at all ages 
Mining Sector
- Hazardous substances and wastes released in water, air, and soil by mining and manufacturing industries can have serious, negative impacts on public health (ELAW 2010). [Indicator UN 3.9.1; EUROSTAT 11.50]
- In mining communities, population growth due to migration inflow and gender imbalance can create problems of psychological and behavioural nature (e.g. alcoholism, drug addiction, and prostitution). Local communities in mining areas, especially in developing countries, can register a higher incidence of HIV/AIDS and sexually transmitted infections (e.g. Mactaggart et al. 2018). [Indicator UN 3.3.1]
- Artisanal and Small scale Mining (ASM), especially in developing countries, often operates outside of health and safety standards and environmental legislation. ASM gold mining is responsible for one-quarter to one-third of global mercury pollution, which have severe health impacts on exposed workers and local communities (e.g. Hentschel et al. 2002).
Manufacturing Sector
- In comparison to other manufacturing sectors, risks of severe injuries are generally higher in basic metal production, due to the presence of hazards such as molten metal (ILO 2005). [Indicators EUROSTAT 08.30]
Use Phase
- Some materials used in products and applications can be toxic and have harmful effects on consumers’ health. Innovation projects are in place for the substitution of toxic materials, as foreseen in the REACH Regulation adopted in 2007. This EU legislation aims to improve the protection of human health and the environment from the risks that can be posed by chemicals and raw materials.
- Some raw materials used in medical devices and are indispensable for improving human well-being. This is the case of some critical metals like Tantalum, used in prosthetic devices for humans and Niobium-Titanium alloys used for superconducting magnetic coils in magnetic resonance imager (TIC 2018).
End-of-Life Phase
- If not properly managed, waste can have negative health effects, especially in the case of hazardous waste handling. The treatment of e-waste illegally shipped in developing countries is often managed using rudimentary techniques, causing adverse environmental and health implications (ILO 2012).
Monitoring indicators
- UN Framework:
- 3.3.1 Number of new HIV infections per 1,000 uninfected population, by sex, age and key populations
- 3.9.1 Mortality rate attributed to household and ambient air pollution
- EUROSTAT Framework:
- 08.60 People killed in accidents at work
- 11.50 Exposure to air pollution by particulate matter
- Incidence rate of non-fatal accidents (indicator 23 ‘Occupational safety’)
- Goal 6 Clean water and sanitation
- Goal 8 Decent work and economic growth
- Goal 15 Life on land
- Establishing a European Pillar of Social Rights COM(2017) 250 final
- Monitoring the implementation of the European Pillar of Social Rights COM(2018) 130
- Regulation (EC) No 1907/2006 of the European Parliament and of the Council on the Registration, Evaluation, Authorisation and Restriction of Chemicals (REACH)
References:
- Environmental Law Alliance Worldwide. Guidebook for evaluating mining projects EIAs. 2010.
- Hentschel T, Hruschka F, Priester M. Global Report on Artisanal and Small-Scale Mining. 2002.
- International Labour Organization (ILO) ILO Code of practice on safety and health in the iron and steel industry. 2005
- International Labour Organization (ILO) The global impact of e-waste Addressing the challenge. 2012
- Mactaggart F, McDermott L, Tynan A, Whittaker M. Exploring the broader health and well-being outcomes of mining communities in low- and middle-income countries: A systematic review. Glob Public Health.2018; 13(7):899–913.
- Tantalum-Niobium International Study Center (T.I.C.) Tantalum for health 2018 Available at: https://www.tanb.org/images/Tantalum%20for%20health.pdf [Accessed on 06/07/2018]
Ensure inclusive and equitable quality education and promote lifelong learning opportunities for all 
Mining and Manufacturing Sectors
- Companies can provide training and educational opportunities to the employees [Indicator UN 4.3.1; Eurostat 04.60]. (Azapagic 2004; Veiga et al 2001)
Monitoring indicators
- UN Framework:
- 4.3.1 Participation rate of youth and adults in formal and non-formal education and training in the previous 12 months, by sex
- EUROSTAT Framework:
- 04.60 Adult participation in learning
- Number of educational programmes related to raw materials by country (indicator 10 ‘Knowledge and skills’)
- Goal 8 Decent work and economic growth
- Establishing a European Pillar of Social Rights COM(2017) 250 final
- Monitoring the implementation of the European Pillar of Social Rights COM(2018) 130
References:
- Azapagic A. Developing a framework for sustainable development indicators for the mining and minerals industry. J Clean Prod. 2004; 12(6):639–62.
- Veiga MM, Scoble M, McAllister ML. Mining with communities. In: Natural Resources Forum. Wiley Online Library; 2001. p. 191–202.
Achieve gender equality and empower all women and girls 
Mining Sector
- Historically, the mining sector has always been male-dominated. In the case of large scale mining, women employment is low, very rarely exceed 10% of the total workforce (Jenkins 2014). However, many initiatives and programmes aimed at increasing women involvement in the sector are currently under way [1] .
- Some studies highlight that women are disproportionately affected by the negative impacts of mining, especially those affecting local communities, like environmental degradation, loss of traditional means of livelihood, health, community displacement and human rights abuses (Jenkins 2014; Lozeva & Marinova 2010; Reeson et al. 2012).
- Mining development in rural, isolated areas can bring to widespread social change, which affect women predominantly. For instance, the in-flow migration of mineworkers and the consequent gender imbalance can cause diffusion of alcoholism, drug addiction, prostitution, etc. (e.g. Jenkins 2014; Kitula 2006).
- Recently, attention has been given to the feminisation of the mining sector. This is especially the case in Artisanal Small scale Mining (ASM), where the number of women engaged in mining as a means of livelihood is increasing (Lahiri-Dutt, 2015; Hayes& Perks 2012). [Indicator EUROSTAT 05.20; 05.30].
- Women’s work in ASM, however, is often concentrated in the processing of minerals, carrying out hazardous manual tasks and using extremely toxic substances like mercury. Due to the informal nature of women’s labour in ASM, their status of mineworkers is often not recognized.
Monitoring indicators
- EUROSTAT Framework:
- 05.20 Gender pay gap
- 05.30 Gender employment gap
- Goal 8 Decent work and economic growth
- Establishing a European Pillar of Social Rights COM(2017) 250 final
- Monitoring the implementation of the European Pillar of Social Rights COM(2018) 130
References:
- Hayes K, Perks R. Women in the artisanal and small-scale mining sector of the Democratic Republic of the Congo. In: Lujala P, Rustad SD, editors. High-Value Natural Resources and Peacebuilding. London: Earthscan; 2012. p. 529–44.
- Jenkins K. Women, mining and development: An emerging research agenda. Extr Ind Soc [Internet]. Elsevier; 2014;1(2):329–39.
- Kitula AGN. The environmental and socio-economic impacts of mining on local livelihoods in Tanzania: A case study of Geita District. J Clean Prod. 2006 ;14(3–4):405–14.
- Lahiri-Dutt, K. 2015. “The feminization of Mining” in Geography Compass, vol. 9, No.9, 523-541
- Lozeva S, Marinova D. Negotiating gender: Experience from Western Australian mining industry. J Econ Soc Policy. 2010;13(2):7.
- Reeson AF, Measham TG, Hosking K. Mining activity, income inequality and gender in regional Australia. Aust J Agric Resour Econ. Wiley Online Library; 2012;56(2):302–13.
[1] Eg: https://www.mihr.ca/pdf/MiHR_Gender_Report_EN_WEB.pdf; https://wimng.org/;
https://commdev.org/userfiles/files/2583_file_IFC_Case_study_CS4_7.pdf; https://www.womeninmining.org.uk/
Ensure availability and sustainable management of water and sanitation for all 
Mining and Manufacturing Sectors
- Mining activities contribute to the release of pollutants to water, soils and air during extraction, ore processing, etc. These pollutants contain acidifying, hazardous and other substances that pose negative impacts on water quality. Toxic effluents and leakages from waste management or storage facilities might also penetrate groundwater resources (IRP-UNEP, forthcoming; Northey et al., 2016), which are essential sources of clean water in many areas.
- Acid Mine Drainage, which can occur also post-closure, can have extended impacts on water and soils quality (IRP-UNEP, forthcoming). [Indicator UN 6.3.1; 6.3.2] [Indicator EUROSTAT 06.30]
- Mining operations can create local water stress (Northey et al., 2016). The mining and processing of some commodities are among the most water-intense economic activities (Zal et al. 2017, Eurostat 2014), which can be placed in water-scarce environments. Decreasing ore grades might probably lead to increasing water requirements by the sector, while the climate change is expected to decrease water availability (ICMM, 2013).Pressures on water availability can exist also during exploration and post-closure stages for the case of mining, and might be also caused by manufacturing facilities. [Indicator UN 6.4.1] [Indicator EUROSTAT 06.60]
- Manufacturing industries are responsible for the release of pollutants to water, air and soil. [Indicator UN 6.3.1; 6.3.2] [Indicator EUROSTAT 06.30]
- Reuse and recycling of water at mining and manufacturing facilities can contribute to reducing pressures on water resources in terms of quantity and quality. [Indicator UN 6.3.1; 6.3.2; 6.4.1; 6.4.2] [Indicator EUROSTAT 06.30; 06.60]
- Mine dewatering can provide additional water resources for other water uses. This water supply can also continue post-closure whenever the site post-closure management plan envisages the continuation of dewatering. [Indicator UN 6.4.2.] [Indicator EUROSTAT 06.60]
- On the other hand, mine dewatering can alter the groundwater table under some circumstances (Northey et al, 2016), which might reduce local water availability and pose environmental impacts on the related ecosystems. This can also affect transboundary water bodies. [Indicator UN 6.3.2; 6.4.1]
- Relief alteration by extractive activities might derive in the formation of pit lakes. [Indicator UN 6.3.2]
Use Phase
- Some materials such as sand are essential for water treatment techniques. [Indicator UN 6.3.1] [Indicator EUROSTAT 06.30]
End-of-Life Phase
- If not properly managed, waste can have negative impacts on water bodies and soils, especially in the case of hazardous waste handling. The treatment of e-waste illegally shipped in developing countries is often managed using rudimentary techniques, causing adverse environmental and health implications (ILO 2012). [Indicator UN 6.3.2]
Monitoring indicators
- UN Framework:
- 6.3.1 Proportion of wastewater safely treated
- 6.3.2 Proportion of bodies of water with good ambient water quality
- 6.4.1 Level of water stress: freshwater withdrawal as a proportion of available freshwater resources
- 6.4.2 Level of water stress: freshwater withdrawal as a proportion of available freshwater resources
- EUROSTAT Framework:
- 06.30 Biochemical oxygen demand in rivers
- 06.60 Water Exploitation Index
- Water (indicator 20 ‘Water’)
- Goal 2 Zero hunger
- Goal 3 Good health and well-being
- Goal 12 Responsible consumption and production
- Goal 13 Climate action
- Goal 14 Life below water
- Industrial Emissions Directive ( 2010/75/EU) and Best Available Techniques (BAT) reference documents
- Water Framework Directive ( 2000/60/EC)
- European Innovation Partnership (EIP) on Water
- European Commission work on water reuse
References:
- Zal N, Bariamis G, Zachos A, Baltas E, Mimikou M. Use of Freshwater Resources in Europe 2002-2014. An assessment based on water quantity accounts. European Environment Agency - European Topic Centre on Inland, Coastal and Marine Water (EEA – ETC/ICM) – Technical Report 1/2017. 2017.
- International Council on Mining and Metals (ICMM). Adapting to a changing climate: implications for the mining and metals industry. 2013.
- International Labour Organization (ILO). The global impact of e-waste. Addressing the challenge. 2012.
- Northey SA, Mudd GM, Saarivuori E, Wessman-Jääskeläinen H, Haque N. Water footprinting and mining: Where are the limitations and opportunities? Journal of Cleaner Production. 2016.
- Eurostat. Data Collection Manual for the OECD/Eurostat Joint Questionnaire on Inland Waters Tables 1 – 8, Concepts, definitions, current practices, evaluations and recommendations. Version 3.0. 2014
- United Nations Environment Programme International Resources Panel (IRP-UNEP), Mineral Resource Governance in the 21st Century: Gearing extractive industries towards sustainable development. Forthcoming.
Ensure access to affordable, reliable, sustainable and modern energy for all 
Mining and Manufacturing Sectors
- Raw materials extractive and manufacturing activities are generally energy-intensive (EC, 2016). This applies to onsite operation but also to transport of materials from sourcing countries, and other energy embodied in the production chain such as the energy required to produce the chemicals used for ore processing, etc. Moreover, the decrease in ore grades leads to increasing processing with the associated increase in energy use. [Indicator UN 7.3.1] [Indicator EUROSTAT 07.30; 07.40]
- Raw materials are required for the deployment of low-carbon and renewable technologies (Blagoeva et al., 2016) [Indicator UN 7.2.1; 7.3.1; 7.3.2] [Indicator EUROSTAT 07.30; 07.40]
- Mining operations create and maintain energy infrastructure such as electricity grids, which can also supply the local population [Indicator UN 7.1.1]
Use Phase
- The use of specific raw materials can have a strong impact on the energy requirement during the product use phase. For instance, the use of aluminium, lighter than other alternative materials, in vehicles can reduce energy demand. It is important to consider the associated energy requirements all along the material life cycle, since the energy requirements for the production of aluminium might not pay-off the reduction of energy requirements during the use phase. [Indicator UN 7.3.1] [Indicator EUROSTAT 07.10; 07.20]
Monitoring indicators
- UN Framework:
- 7.1.1 Proportion of population with access to electricity
- 7.2.1 Proportion of population with primary reliance on clean fuels and technology
- 7.3.1 Energy intensity measured in terms of primary energy and GDP
- 7.3.2 Renewable energy share in the total final energy consumption
- EUROSTAT Framework:
- 07.10 Primary and final energy consumption
- 07.20 Final energy consumption in households per capita
- 07.30 Energy productivity
- 07.40 Share of renewable energy in gross final energy consumption
- Raw materials in low-carbon technologies (introduction)
- Demand forecast in the EU for selected critical raw materials for the hybrid and electric vehicles segments (introduction, forthcoming Scoreboard 2018)
- Goal 12 Responsible consumption and production
- Goal 13 Climate action
- The Paris Protocol – A blueprint for tackling global climate change beyond COM (2015)81
- Directive (EU) 2018/410 of the European Parliament and of the Council of 14 March 2018 amending Directive 2003/87/EC to enhance cost-effective emission reductions and low-carbon investments, and Decision (EU) 2015/1814
- The 2030 Climate and Energy Policy Framework
- Establishing a European Pillar of Social Rights COM(2017) 250 final
- Monitoring the implementation of the European Pillar of Social Rights COM(2018) 130
References:
- European Commission (EC). Raw materials Scoreboard European Innovation Partnership on Raw Materials. Luxembourg; 2016.
- Blagoeva D, Alves Dias P, Marmier A, Pavel. Assessment of potential bottlenecks along the materials supply chain for the future deployment of low-carbon energy and transport technologies in the EU: Wind power, photovoltaic and electric vehicles technologies, time frame: 2015-2030. 2016.
- Intergovernmental Panel on Climate Change (IPCC), Working Group III Report ‘Climate Change 2014: Mitigation of Climate Change’. 2014
Promote sustained, inclusive and sustainable economic growth, full and productive employment and decent work for all 
Cross-Cutting Issues
- According to EUROSTAT data, in 2014, the economic activities related to biotic and abiotic raw materials production employed more than 4.4 million people (EC 2016) [Indicator EUROSTAT 08.30].
- The contribution of the raw materials sectors to EU employment goes far beyond economic activities strictly related to the production of materials. Downstream in the supply chain, the number of jobs created in the manufacture of semi-finished products is a lot higher than the number of jobs from materials production alone (EC 2016).
- The raw materials sectors (especially mining and forestry) are characterised by a high degree of informality, particularly in developing countries. For instance, the global mining industry employs around 2.5 million people, while, according to estimates, informal mining activities provide jobs for 15–20 million people (ICMM 2014). In the forest sector, informal work in the sector is fostered by the expansion of illegal logging. [Indicator UN 8.3.1]
Mining Sector
- Especially in developing countries, occupational hazards, work accidents and child labour particularly affect the mining sector. According to the ILO, more than one million children work as miners worldwide. They are almost exclusively found in artisanal small-scale mining operations in Africa, Asia and Latin America. [Indicator UN 8.7.1]
Forestry
- In Europe, forestry has the highest accidents rate among the raw materials sectors, but the trend is decreasing (EC 2016). Forestry work is generally considered hazardous (EU-OSHA 2013), due to the widespread use of manual operations, in spite of the increasing mechanization in the sector. [Indicator UN 8.8.1; EUROSTAT 08.60]
Manufacturing Sector
- In comparison to other manufacturing sectors, risks of severe injuries are generally higher in basic metal production, due to the presence of hazards such as molten metal (ILO 2005).
End-of-Life Phase
- The waste management and recycling sectors contribute significantly to employment. According to estimates from various sources, 3.4 million jobs have been created by circular economy-related activities in the EU (WRAP 2015)
Monitoring indicators
- UN Framework:
- 8.3.1 Proportion of informal employment in non-agriculture employment, by sex
- 8.7.1 Proportion and number of children aged 5–17 years engaged in child labour, by sex and age
- 8.8.1 Frequency rates of fatal and non-fatal occupational injuries, by sex and migrant status
- EUROSTAT Framework:
- 08.30 Employment rate
- 08.60 People killed in accidents at work
- Number of jobs (right) for a selection of raw materials economic sectors in the EU (2008-2012) (indicator 7 ‘Value added and jobs’)
- Incidence rate of non-fatal accidents for a selection of economic sectors (indicator 23 ‘Occupational safety’)
- Goal 3 Good health and well-being
- Goal 10 Reduced inequalities
- Establishing a European Pillar of Social Rights COM(2017) 250 final
- Monitoring the implementation of the European Pillar of Social Rights COM(2018) 130
- Raw Materials Initiative COM (2008) 699 final
- For a European Industrial Renaissance COM (2014) 014 final
- European Innovation Partnership on Raw Materials COM(2012) 82 final
- Circular Economy Package
References:
- European Agency for Safety and Health at Work (EU-OSHA). Green jobs and occupational safety and health: Foresight on new and emerging risks associated with new technologies by 2020. 2013
- European Commission (EC) -. Raw materials Scoreboard European Innovation Partnership on Raw Materials. Luxembourg; 2016.
- International Council on Mining and Metals (ICMM). The role of mining in national economies, 2nd ed., 6. 2014.
- Wrap (2015) Economic Growth Potential of More Circular Economies
Build resilient infrastructure, promote inclusive and sustainable industrialization and foster innovation 
Mining Sector
- The presence of mining activities in a region can contribute to local and regional development through the provision and improvement of related physical infrastructures. Road networks, power and water networks, or health care systems, form the physical basis of society, and allows the local population to access e.g. health and education services, and the economy to function (e.g. Hilson 2002; Weldegiorgis&Ali 2016) [Indicator UN 9.1.1].
Manufacturing Sector
- The average R&D investment in the EU raw materials sectors considerably increased in the last decade, especially for the mining and production of iron, base metals, other minerals and coal (EC 2018). [Indicator UN 9.5.1; EUROSTAT 9.10]
- Among different raw materials sectors, the number of worldwide [1] patent applications are highest in the production and manufacturing of both metals and non-metallic mineral products. (EC 2018). The relative increases are highest for the mining and mineral processing, followed by recycling and production and manufacturing of non-metallic mineral products (JRC 2018) [Indicator EUROSTAT 9.40]
Use Phase
- Raw materials are widely used in various applications, including physical infrastructure, machinery, and final use applications. Some critical metals and materials are required for renewable energy componentry and related technologies, such as batteries for energy storage. These include copper, cobalt, cadmium, tellurium, and rare earth elements (REEs) (Blagoeva et al. 2016). [Indicator UN 9.4.1]
Monitoring indicators
- UN Framework:
- 9.1.1 Proportion of the rural population who live within 2 km of an all-season road
- 9.1.2 Passenger and freight volumes, by mode of transport
- 9.2.2 Manufacturing employment as a proportion of total employment
- 9.4.1 CO2 emission per unit of value added
- 9.5.1 Research and development expenditure as a proportion of GDP
- 9.5.2 Researchers (in full-time equivalent) per million inhabitants
- EUROSTAT Framework:
- 09.10 Gross Domestic expenditure on R&D
- 09.40 Patent applications to the European Patent Office
- Annual R&D investment by key EU-based investing companies by raw material sector group (indicator 8 Corporate R&D investment)
- Comparison of the Number of patent applications by the raw material sector, and its five contributing raw material categories (EU and a selection of non-EU reference countries) (indicator 9 ‘Patent applications’)
- Emissions of greenhouse gases (indicator 19 ‘Air emissions’)
- Goal 8 Decent work and economic growth
- Goal 7 Affordable and clean energy
- Goal 11 Sustainable cities and communities
- Goal 13 Take urgent action to combat climate change and its impacts
- Raw Materials Initiative COM (2008) 699 final
- For a European Industrial Renaissance COM (2014)014 final
- Circular Economy Package
- The 2030 Climate and Energy Policy Framework
References:
- Blagoeva D, Alves Dias P, Marmier A, Pavel. Assessment of potential bottlenecks along the materials supply chain for the future deployment of low-carbon energy and transport technologies in the EU: Wind power, photovoltaic and electric vehicles technologies, time frame: 2015-2030. 2016.
- European Commission (EC). Raw materials Scoreboard European Innovation Partnership on Raw Materials. Luxembourg; forthcoming.
- Hilson G. An overview of land use conflicts in mining communities. Land use policy 19(1):65–73. 2002.
- Weldegiorgis FS, Ali SH. Mineral resources and localised development: Q-methodology for rapid assessment of socioeconomic impacts in Rwanda. Resour Policy. 2016.
[1] The analysis refers to a selection of countries leading in the field of patent applications, i.e. Canada, the European Union, Japan, Russia, South Korea, the United States.
Reduce inequality within and among countries 
Mining Sector
- Mining activity can be a significant driver of export growth as well as income and employment. However, while income growth is an economic benefit, the high incomes associated with the mining sector may also lead to greater inequality (Loayza&Rigolini 2016; Fleming&Measham 2015 Jenkins 2014).
- Worldwide, the mining industry is characterised by the significant presence of foreign migrant workers . Working conditions usually vary in large-scale compared with small-scale mining, as well as in developing compared with developed countries. In general, temporary low-skilled migrant workers are often more vulnerable to the risk of employer exploitation and are not always paid at current market rates for the work (ILO 2016) [Indicator UN 10.7.1; 10.7.2].
Monitoring indicators
- UN Framework:
- 10.7.1 Recruitment cost borne by employee as a proportion of yearly income earned in country of destination
- 10.7.2 Number of countries that have implemented well-managed migration policies
- Goal 1 No poverty
- Goal 8 Decent work and economic growth
- Establishing a European Pillar of Social Rights COM(2017) 250 final
- Monitoring the implementation of the European Pillar of Social Rights COM(2018) 130
References:
- International Labour Organization (ILO). International migrant workers in the minig sector. Authors: Mylène Coderre-Proulx, Bonnie Campbel, Issiaka Mandé; International Labour Office, Sectoral Policies Department, Conditions of Work and Equality Department. – Geneva: ILO, 2016
- Fleming DA, Measham TG. Income Inequality across Australian Regions during the Mining Boom: 2001–11. Aust Geogr.46(2). 2015
- Jenkins K. Women, mining and development: An emerging research agenda. Extr Ind Soc. 1(2):329–39 2014.
- Loayza N, Rigolini J. The Local Impact of Mining on Poverty and Inequality: Evidence from the Commodity Boom in Peru. World Dev. 84:219–34. 2016
Make cities and human settlements inclusive, safe, resilient and sustainable 
Mining Sector
- Mining activities in developing countries can contribute to the creation and expansion of slums around the operation facility and to local socio-economic inequalities (IRP-UNEP, forthcoming). [Indicator UN 11.1.1; 11.3.1] [Indicator EUROSTAT 11.10]
- The development of mining activities can lead to damages in the local cultural and aesthetic heritage (Mancini&Sala, 2018). Simultaneously, mining industries can also invest funds in the preservation of the local natural and cultural heritage.
- In mining communities, population growth due to migration inflow and gender imbalance can lead to behaviours such as alcoholism, drug addiction, and prostitution, which can in turn lead to also higher rates of physical and sexual harassment. [Indicator UN 11.7.2]
- Mines might be converted into parks and green spaces after closure. [Indicator UN 11.7.1]
Mining and Manufacturing Sectors
- Land use conversion into mining, processing and manufacturing facilities increases the land footprint of the sector. [Indicator UN 11.1.1]
- Mining, processing and manufacturing facilities can generate noise. [Indicator EUROSTAT 11.20]
- Accidents might occur at mining, processing and manufacturing facilities. Often, costs associated to the environmental and socio-economic recovery are assumed by the operating companies, and can eventually pose an economic burden for the public authorities in charge.
- Industrial facilities can contribute to the release and formation of particulate matter in populated areas. [Indicator UN 11.6.2] [Indicator EUROSTAT 11.50]
Use Phase
- Raw materials are essential for the development of sustainable and resilient urban infrastructure, including adequate housing and public transport networks, among other. [Indicator UN 11.1.1; 11.2.1; 11.6.2] [Indicator EUROSTAT 11.30]
- Raw materials are essential for the development of end-of pipe technologies for pollution abatement [Indicator UN 11.6.2]
End-of-Life Phase
- If not properly managed, waste disposal can create slums around and foster socio-economic imbalances and health concerns. [Indicator UN 11.1.1]
Monitoring indicators
- UN Framework:
- 11.1.1 Proportion of urban population living in slums, informal settlements or inadequate housing
- 11.2.1 Proportion of population that has convenient access to public transport, by sex, age and persons with disabilities
- 11.3.1 Ratio of land consumption rate to population growth rate
- 11.3.2 Proportion of cities with a direct participation structure of civil society in urban planning and management that operate regularly and democratically
- 11.6.2 Annual mean levels of fine particulate matter (e.g. PM2.5 and PM10) in cities (population weighted)
- 11.7.1 Average share of the built-up area of cities that is open space for public use for all, by sex, age and persons with disabilities
- 11.7.2 Proportion of persons victim of physical or sexual harassment, by sex, age, disability status and place of occurrence, in the previous 12 months
- EUROSTAT Framework:
- 11.10 Overcrowding rate
- 11.20 Population living in households considering that they suffer from noise
- 11.50 Exposure to air pollution by particulate matter
- Tropospheric ozone formation potential (TOFP) emissions (indicator 19 ‘Air emissions’)
- Particulate matter emissions and non-methane volatile organic compounds (NMVOC) emissions (indicator 21 ‘Air pollutant emissions’, in forthcoming 2018 Scoreboard)
- Goal 1 No poverty
- Goal 3 Good health and well-being
- Goal 6 Clean water and sanitation
- Goal 9 Industry, innovation and infrastructure
- Goal 10 Reduced inequalities
- Goal 15 Life on land
- 7th Environmental Action Programme (7EAP) under Priority Objective 8, entitled, Sustainable Cities: " Working together for Common Solutions".
References:
- Mancini L, Sala S. Social impact assessment in the mining sector: Review and comparison of indicators frameworks. Resour Policy. 2018.
- United Nations Environment Programme International Resources Panel (IRP-UNEP). Mineral Resource Governance in the 21st Century: Gearing extractive industries towards sustainable development. Forthcoming.
Responsible consumption and production 
Cross-Cutting Issues
- Using raw materials more efficiently means gaining more value per unit of resource used in a production-consumption system, and decoupling the economic growth from the use of natural resources. Resource efficiency is an objective in both the European environmental policy (EC 2011, 2015) and the industrial policy (EC 2017). The raw materials sectors have a key role in pursuing the resource efficiency goal, because they produce inputs for other end use sectors. Moreover, the amount of natural resources (land, water, energy, etc…) used to extract materials and produce semi-finished products can be optimized through innovative and clean technologies [Indicator UN 12.2.1; 12.2.2; EUROSTAT 12.20; 07.30].
- Mining and manufacturing activities can generate prominent amounts of waste, emissions and effluents. Especially in the case of hazardous waste, the best available technologies have to be applied in order to minimize waste flows and related environmental impacts.
Manufacturing Sector
- Eco-design plays a key role in enhancing resource efficiency of products. It allows making products more energy and material efficient, more durable, reparable and easier to be dismantled at End-of-Life phase (e.g. Tecchio et al. 2016).
Use Phase
- The consumption phase has an important role in improving resource efficiency and reducing environmental impacts.
- Re-using and repairing products allow extending their life span and reducing the waste flows (including hazardous waste) and the related environmental impacts [EUROSTAT 12.41].
End-of-Life Phase
- The waste management phase and the production of secondary raw materials have a crucial role in improving the circularity of the economy, and to reduce the environmental impacts due to primary production (in terms of emissions to air, water bodies and soil, biodiversity loss, etc.) (Huisman et al.,2008). Recycling is also important for improving sustainability, and contributes to the security of supply of raw materials. While the recycling contribution to meeting material demand is actually quite low (EC 2016) quality standards and eco-design can boost the market for secondary materials [Indicator UN 12.5.1; 12.6.1; EUROSTAT 12.41; 12.50; 12.60].
Monitoring indicators
- UN Framework:
- 12.2.1 Material footprint, material footprint per capita, and material footprint per GDP
- 12.2.2 Domestic material consumption, domestic material consumption per capita, and domestic material consumption per GDP
- 12.5.1 National recycling rate, tons of material recycled
- 12.6.1 Number of companies publishing sustainability reports
- EUROSTAT Framework:
- 12.20 Resource productivity and domestic material consumption
- 12.30 Energy productivity
- 12.41 Circular material use rate
- 12.50 Generation of waste excluding major mineral wastes
- 12.60 Recycling rate of waste excluding major mineral wastes
- Domestic material consumption by resource category (indicator 15 ‘Material flows in the circular economy’)
- End-of-life recycling input rates (EOL-RIR) for a selection of raw materials (indicator 16 ‘Recycling’s contribution to meeting materials demand’)
- Electrical and electronic equipment put on the market, WEEE collected, reused and recycled (indicator 17 “WEEE management)
- Trade in selected waste materials to and from the EU (indicator 18 Trade in secondary raw materials; indicator 18 ‘Trade of waste and scraps’, in forthcoming Scoreboard 2018)
- Extractive waste management (indicator 21 ‘Extractive waste management’; indicator 23 ‘Extractive waste’)
- Number of companies that have joined the Global Reporting Initiative (GRI) (indicator 24 ‘Sustainability reporting’)
- Construction and demolition waste (indicator 19, in forthcoming 2018 Scoreboard)
- Goal 6 Clean water and sanitation
- Goal 7 Affordable and clean energy
- Goal 9 Industry, innovation and infrastructure
- Goal 11 Sustainable cities and communities
- Goal 13 Climate action
- Roadmap to a Resource Efficient Europe COM(2011) 571
- Circular economy Action Plan COM(2015)614
- 7th Environmental Action Programme (7EAP)
- EU Forest Strategy COM(2013)659
- EU Eco-Management and Audit Scheme (EMAS)
- Directive 2012/19/EU of the European Parliament and of the Council of 4 July 2012 on waste electrical and electronic equipment (WEEE).
- Directive 2009/125/EC of the European Parliament and of the Council of 21 October 2009 establishing a framework for the setting of Ecodesign requirements for energy-related products
- Directive 2010/30/EU of the European Parliament and of the Council of 19 May 2010 on the indication by labelling and standard product information of the consumption of energy and other resources by energy-related products
- Regulation (EC) No 66/2010 of the European Parliament and of the Council of 25 November 2009 on the EU Ecolabel
- Regulation (EC) No 1907/2006 of the European Parliament and of the Council on the Registration, Evaluation, Authorisation and Restriction of Chemicals (REACH)
References:
- Ardente, F. Mathieux, F., Sanfélix Forner, J. Integration of resource efficiency and waste management criteria in European product policies – Second phase. 2012.
- European Commission (EC). Roadmap to a Resource Efficient Europe. Vol. COM(2011)5. 2011.
- European Commission (EC). Closing the loop - An EU action plan for the Circular Economy. 2015.
- European Commission (EC). Raw materials Scoreboard European Innovation Partnership on Raw Materials. Luxembourg; 2016.
- European Commission (EC). Investing in a smart, innovative and sustainable Industry. A renewed EU industrial Policy Strategy. 2017.
- Huisman, J., F. Magalini, R. Kuehr, C. Maurer, S. Ogilvie, J. Poll, C. Delgado, E. Artim, J. Szlezak and A. Stevels (2008). Review of Directive 2002/96 on Waste Electrical and Electronic Equipment (WEEE). Bonn, Germany, United Nations University.
- Tecchio, P., Ardente, F., Mathieux, F.; Analysis of durability, reusability and reparability — Application to washing machines and dishwashers. 2016.
Take urgent action to combat climate change and its impacts 
Mining and Manufacturing Sectors
- Mining, smelting and refining are particularly energy-intensive industries which produce significant amounts of greenhouse gases emissions [Indicator EUROSTAT 13.20; 13.30]
Forestry
- The forest sector can play a major role in climate change mitigation, through the sequestration of carbon dioxide (CO 2), a major contributor to greenhouse effect, from the atmosphere. Forests accumulate large stocks of carbon in the form of woody biomass and in forest soils. In sustainably managed forests, the amount of carbon that can be released as a result of harvesting is equal to or smaller than the amount taken from the atmosphere, making forests “carbon-neutral” or “carbon sinks”.
Use Phase
- Power generation is one of the major contributors to climate change. Low-carbon energy technologies, which require specific raw material, including also critical materials (Kleijn et al. 2011), can substantially reduce the carbon emissions [Indicator EUROSTAT 07.40].
End-of-Life Phase
- Reuse, Recovery and Recycling (RRR) allow reducing the emission due to the production of primary materials (Deloitte 2016)
- Reducing scavenging and export of cooling and freezing appliances and treatment according to standards limits emissions of CFC and reduces, besides ozone-layer depletion, the release of gases with a very high CO2 equivalent (Huisman et al., 2015)
Monitoring indicators
- EUROSTAT Framework:
- 13.20 Greenhouse gas emissions intensity of energy consumption
- 13.30 Greenhouse gas emissions
- 13.40 Share of renewable energy in gross final energy consumption
- Emissions of greenhouse gases (A) and gases with tropospheric ozone formation potential (B) (indicator 19 ‘Air emission’)
- Goal 6 Clean water and sanitation
- Goal 7 Affordable and clean energy
- Goal 9 Industry, innovation and infrastructure
- Goal 11 Sustainable cities and communities
- Goal 12. Responsible consumption and production
- Goal 15 Life on land
- Paris agreement
- 2020 climate and energy package
- 2030 climate and energy framework
- 2050 low-carbon roadmap
- EU Emission Trading System
- EU Forest Strategy COM(2013)659
- Circular Economy Package
References:
- Kleijn R, van der Voet E, Kramer GJ, van Oers L, van der Giesen C. Metal requirements of low-carbon power generation. Energy. 36(9):5640–8. 2011.
- Deloitte Sustainability. Circular economy potential for climate change mitigation. 2016 Available at https://www2.deloitte.com/content/dam/Deloitte/fi/Documents/risk/Deloitte%20-%20Circular%20economy%20and%20Global%20Warming.pdf [Accessed on 06/07/2018]
- Huisman, J., Botezatu, I., Herreras, L., Liddane, M., Hintsa, J., Luda di Cortemiglia, V., Leroy, P., Vermeersch, E., Mohanty, S., van den Brink, S., Ghenciu, B., Dimitrova, D., Nash, E., Shryane, T., Wieting, M., Kehoe, J., Baldé, C.P., Magalini, F., Zanasi, A., Ruini, F., and Bonzio, A.. Countering WEEE Illegal Trade (CWIT) Summary Report, Market Assessment, Legal Analysis, Crime Analysis and Recommendations Roadmap. 2015.
Conserve and sustainably use the oceans, seas and marine resources for sustainable development 
Mining Sector
- Mining sites close to the marine environment may dispose tailings into the sea (seabed and deep-sea zone). This generally reduces the abundance of aquatic life (IRP-UNEP, forthcoming). Moreover, the entire range of impacts of waste disposal is not yet fully known. Discharges, leakages and Acid Mine Drainage can also contribute to sea pollution with toxic substances (IRP-UNEP, forthcoming). [Target UN 14.1]
- Sea dredging and deep-sea mining may have a direct negative impact on coastal lagoons and the seabed and can target areas with high nature conservation value and/or valuable fisheries (IRP-UNEP, forthcoming). Deep-sea mining is likely to cause many adverse impacts on deep-sea ecosystems through increasing release of toxic substances and the agitation of sediment (WEF, 2016). The potential impacts of deep-sea mining are in focus, especially for governments of small island developing states that depend on marine life. However, little is known about the full impacts of this practice (IRP-UNEP, forthcoming; WEF, 2016). [Target UN 14.1; 14.2; 14.7].
- Materials are shipped via maritime transport, with the associated negative impacts on the marine environment [Target UN 14.1]
- Some mining activities might have radioactivity leaks that could end in the marine environment (UNEP, forthcoming) [Target UN 14.1]
- Raw materials are essential for the development of new technologies to improve the environmental performance of minerals processing [Target UN 14.1]
Manufacturing Sector
- Raw materials facilities release pollutants to soils, air and water that can end in the marine environment, with the subsequent impacts on life below water. [Target UN 14.1]
- Raw materials are essential for the development of end-of pipe technologies for pollution abatement and new technologies to optimize industrial processes [Target UN 14.1]
End-of-Life Phase
- If not properly managed, waste disposal close to marine and coastal ecosystems can impact them negatively, especially in the case of hazardous waste handling. [Target UN 14.1]
Monitoring indicators
- UN Framework:
- (Target) 14.1 By 2025, prevent and significantly reduce marine pollution of all kinds, in particular from land-based activities, including marine debris and nutrient pollution
- (Target) 14.2 By 2020, sustainably manage and protect marine and coastal ecosystems to avoid significant adverse impacts, strengthen their resilience, and achieve healthy and productive oceans
- 5.1 Coverage of protected areas in relation to marine areas
- (Target) 14.7 By 2030, increase the economic benefits to small island developing States and least developed countries from the sustainable use of marine resources, including through sustainable management of fisheries, aquaculture and tourism
- Goal 2 Zero hunger
- Goal 6 Clean water and sanitation
- Goal 15 Life on land
- Industrial Emissions Directive ( 2010/75/EU) and Best Available Techniques (BAT) reference documents
- Water Framework Directive ( 2000/60/EC)
- Directive 2006/21/EC of the European Parliament and of the Council on the management of waste from the extractive industries
- Blue Growth opportunities for marine and maritime sustainable growth
References:
- United Nations Environment Programme International Resources Panel (IRP-UNEP). Mineral Resource Governance in the 21st Century: Gearing extractive industries towards sustainable development. Forthcoming.
- World Economic Forum (WEF), United Nations Development Programme or United Nations member states, Columbia Center on Sustainable Investment or Sustainable Development Solutions Network. Mapping Mining to the Sustainable Empowered lives. Resilient nations. Development Goals: An Atlas. 2016.
Protect, restore and promote sustainable use of terrestrial ecosystems, sustainably manage forests, combat desertification, and halt and reverse land degradation and halt biodiversity loss 
Mining Sector
- Mining is one of the most widespread and invasive land uses that causes land degradation (Cherlet et al 2018). Mining activities can lead to deforestation, desertification and loss of biological productivity (WEF, 2016). This derives from practices such as land clearance (to access deposits, storage, waste management, etc) and materials extraction, which apart from the direct removal of plant cover and materials also reduce soil particles size, which favours further erosion. These impacts take also place during exploration and post-closure.
- Abandoned sites, whose stabilisation and restoration typically requires long-term efforts, comes with endemic problems such as the accumulation of large amounts of waste and reactive materials (e.g. tailings rich sulphide minerals leading to acid mine drainage) (Cherlet et al 2018).
- Artisanal mining presents another set of problems, like soil pollution in gold extraction due to te uncontrolled use of chemicals (Cherlet et al 2018).
- Loss of natural or agricultural land subsequently reduces the biomass provision capacity of the area and the carbon capture capacity (WEF, 2016). [Indicator UN 15.1.1; 15.3.1; 15.4.2] [Indicator EUROSTAT 15.10; 15.30; 15.50]
- Mining can cause biodiversity loss through the loss of forest, mixed agricultural/forest, and/or low impact agriculture areas. Ecosystems can be directly be removed and/or fragmented, and/or affected by air, water and soil pollution (IPR-UNEP, 2016), and by increasing vehicles traffic (WEF, 2016). This can be of particular relevance in areas with high nature conservation value and high vulnerability. This impacts might be irreversible. They take also place during exploration and post-closure. Mining industries often invest fund activities to offset their negative impacts on biodiversity [Indicator UN 15.a.1]
Manufacturing Sector
- Manufacturing facilities can have impacts on biodiversity due land use change, the release of pollutants to air, water and soil pollution and increasing vehicles traffic (WEF, 2016). However, the impacts are generally localized in space and time. Accidents can pose large and/or acute impacts on biodiversity. [Indicator UN 15.1.1; 15.3.1; 15.4.2; 15.5.1] [Indicator EUROSTAT 15.10; 15.30; 15.60; 15.61]
- Raw materials are essential for the development of end-of pipe technologies for pollution abatement and new technologies to improve the environmental performance of minerals processing and production [Indicator UN 15.3.1; 15.4.2; 15.51] [Indicator EUROSTAT 15.60; 15.61]
Forestry
- Forestry activities can lead to biodiversity loss through the land clearance and cultivation of high yield/commercial forest species, which might even be based on alien species. [Indicator UN 15.2.1; 15.8.1]
- If properly managed, forests can preserve terrestrial biodiversity and provide a variety of ecosystem services
End-of-Life Phase
- If not properly managed, waste disposal can impact land ecosystems negatively, especially in the case of hazardous waste handling.
Monitoring indicators
- UN Framework:
- 15.1.1. Forest area as a proportion of total land area
- 15.2.1 Progress towards sustainable forest management
- 15.3.1 Proportion of land that is degraded over total land area
- 15.4.2 Mountain Green Cover Index
- 15.5.1 Red List Index
- 15.8.1 Proportion of countries adopting relevant national legislation and adequately resourcing the prevention or control of invasive alien species
- 15.a.1 Official development assistance and public expenditure on conservation and sustainable use of biodiversity and ecosystems
- EUROSTAT Framework:
- 15.10 Share of forest area
- 15.30 Artificial land cover per capita
- 15.50 Estimated soil erosion by water
- 15.60 Common bird index
- 15.61 Grassland butterfly index
- Felling rates as percentage of net forest increment (indicator 22 ‘Sustainable wood supply)
- Wood growing stock in forest available for wood supply (indicator 24 ‘Wood supply, in forthcoming 2018 Scoreboard)
- Goal 2 Zero hunger
- Goal 6 Clean water and sanitation
- Goal 11 Sustainable cities and communities
- Goal 13 Climate action
- Goal 14 Life below water
- Habitats directive
- Birds directive
- Natura 2000
- Our life insurance, our natural capital: an EU Biodiversity Strategy to 2020 COM(2011) 244
- Soil Thematic Strategy
- EU Forest Strategy COM(2013)659
References:
- Cherlet, M., Hutchinson, C., Reynolds, J., Hill, J., Sommer, S., von Maltitz, G. (Eds.), World Atlas of Desertification. 2018.
- United Nations Environment Programme International Resources Panel (IRP-UNEP). Mineral Resource Governance in the 21st Century: Gearing extractive industries towards sustainable development. Forthcoming.
- World Economic Forum (WEF), United Nations Development Programme or United Nations member states, Columbia Center on Sustainable Investment or Sustainable Development Solutions Network. Mapping Mining to the Sustainable Empowered lives. Resilient nations. Development Goals: An Atlas. 2016.
Promote peaceful and inclusive societies for sustainable development, provide access to justice for all and build effective, accountable and inclusive institutions at all levels 
Mining Sector
- Especially in developing countries, in mining communities, conflicts and social tensions can rise due to the inequitable distribution of benefits and costs with communities or to limited access to resources. Conflicts between companies and illegal miners, as well as politically motivated killings of anti-mining activists can occur (e.g. Abuja 2016; Switzer 2001; Oyarzún&Oyarzún 2011) [Indicator UN 16.1.2; 16.10.1].
- Human rights abuses related to mining activities can occur for different reasons. In the case of Large Scale industry, mining-induced land loss can threatens the livelihoods of indigenous peoples, as they rely on natural resources and land for their subsistence. Contamination and environmental destruction can similarly comprise the right to maintain access to existing water supplies and can cause severe health problems.
- In Artisanal and Small Scale Mining labour related human rights problems stand out. This is most apparent with problems of child labour and bad working conditions, which can be observed in many parts of the world. Poverty, a low level of mechanization, inefficient extraction methods and insufficient knowledge and expertise are part of the root causes to these problems. A detailed analysis of the human rights risks in mining is available in a report by Max-Planck and BGR (2016). [Indicator UN 8.7.1]
- Corruption in the mining sector can occur to obtain licences and permits or to sway judicial decision. Corruption can create huge revenue losses for public coffers and is one of the main cause for the so called “resource curse” in resource-rich countries (OECD 2016; Kolstad& Søreide 2009) Several initiatives are in place to improve transparency and good governance in the extractive sector. [Indicator UN 16.5.1; 16.5.2; EUROSTAT 16.50]
Manufacturing Sector
- Importers of some minerals and metals (e.g. Tin, Tantalum, Tungsten and Gold) from high-risk and conflict areas need to perform due diligence in order to ensure that they source responsibly. This will be a legal requirement for the EU companies from 2021 (EU 2017) and other countries have similar regulations already in place. The OECD has published the “Due Diligence Guidance for Responsible Supply Chains of Minerals from Conflict-Affected and High-Risk Areas” which is the technical basis of the EU Regulation.
- Similarly, the Council Regulation (EC) No 2368/2002 sets out the criteria for importing or exporting rough diamonds in order to ensure adherence to the requirements of the ‘ Kimberley Process’ (KP).
Monitoring indicators
- UN Framework:
- 16.1.2 Conflict-related deaths per 100,000 population, by sex, age and cause
- 16.10.1 Number of verified cases of killing, kidnapping, enforced disappearance, arbitrary detention and torture of journalists, associated media personnel, trade unionists and human rights advocates in the previous 12 months
- 16.7.1 Proportion and number of children aged 5–17 years engaged in child labour, by sex and age
- 16.5.1 Proportion of persons who had at least one contact with a public official and who paid a bribe to a public official, or were asked for a bribe by those public officials, during the previous 12 months
- 16.5.2 Proportion of businesses that had at least one contact with a public official and that paid a bribe to a public official, or were asked for a bribe by those public officials during the previous 12 months
- EUROSTAT Framework:
- 16.50 Corruption Perception Index
- Geographical concentration of raw materials production and producer countries’ governance levels (indicator 4, Geographical concentration and governance)
- Goal 8 Decent work and economic growth
- Goal 10 Reduced inequalities
- Conflict Minerals Regulation (EU 2017/821)
- Council Regulation (EC) No 2368/2002 implementing the Kimberley Process certification scheme for the international trade in rough diamonds
- Charter of Fundamental Rights of the EU
References:
- Abuya WO. Mining conflicts and Corporate Social Responsibility: Titanium mining in Kwale, Kenya. Extr Ind Soc [Internet]. 3(2):485–93. 2016.
- European Union. Regulation (EU) 2017/821 of the European Parliament and of the Council of 17 May 2017 laying down supply chain due diligence obligations for Union importers of tin, tantalum and tungsten, their ores, and gold originating from conflict-affected and high-risk areas. 2017.
- Kolstad I, Søreide T. Corruption in natural resource management: Implications for policy makers. Resour Policy [Internet]. 34(4):214–26. 2009.
- Max-Planck-Stiftung für internationalen Frieden und Rechtsstaatlichkeit, and Maximilian Spohr. Human Rights Risks in Mining: A Baseline Study. Bundesanstalt für Geowissenschaften und Rohstoffe (BGR), 2016.
- Organisation for Economic Co-operation and Development (OECD). Corruption in the Extractive Value Chain. 2016.
- Organisation for Economic Co-operation and Development (OECD). Due Diligence Guidance for Responsible Supply Chains of Minerals from Conflict-Affected and High-Risk Areas. 2013.
- Oyarzún J, Oyarzún R. Sustainable development threats, inter-sector conflicts and environmental policy requirements in the arid, mining rich, northern Chile territory. Sustain Dev [Internet]. John Wiley & Sons, Ltd.; 19(4):263–74. 2011.
- Switzer J. Armed Conflict and Natural Resources: The Case of the Minerals Sector. 2001.
Strengthen the means of implementation and revitalize the Global Partnership for Sustainable Development 
Cross-Cutting Issues
- All the raw materials sectors can contribute to the achievement of SDGs. The European Innovation Partnership (EIP) on Raw Materials promote innovation in the sector financing ‘Raw Material Commitments’ (RMCs), joint undertakings by several partners that contribute to achieving the actions and targets of the EIP. The annual monitoring survey of the EIP revealed that these Commitments are mainly contributing to Goal 12 (Responsible consumption and production); Goal 8 (Decent work and economic growth) and Goal 9 (Industry, infrastructure and innovation) (EC 2017)
Mining Sector
- Mining companies have an important role in contributing to sustainable development. For instance, in order to convert mineral wealth into positive economic growth, it is crucial to pay a reasonable and fair share of taxes and promoting transparency in the flow of mining revenues between the private sector and states (ICMM 2018).
- Deploying environmentally sound technologies in their operations, employing people and sharing geological data are other means for strengthening the partnership for the Goals, and promote sustainable development according to a Columbia University, UNDP and World Economic Forum study (CCSI at al. 2016). [Indicators UN 17.7.1; 17.11.1; EUROSTAT 17.30]
Monitoring indicators
- UN Framework:
- 17.7.1 Total amount of approved funding for developing countries to promote the development, transfer, dissemination and diffusion of environmentally sound technologies
- 17.11.1 Developing countries’ and least developed countries’ share of global exports
- EUROSTAT Framework:
- 17.30 EU imports from developing countries
- Goal 16 Mining, peace, justice and strong institutions
- Goal 10 Reduced inequalities
- European Commission (EC). Next steps for a sustainable European future European action for sustainability COM (2016) 739 final
- European Commission (EC). Proposal for a new European Consensus on Development Our World, our Dignity, our Future COM (2016) 740 final
References:
- CCSI, UNDP, UN SDSN, WEF. Mapping Mining to the Sustainable Development Goals: An Atlas. 2016.
- European Commission (EC). European Innovation Partnership on Raw Materials: Annual Monitoring Report 2016. 2017.
- International Council on Mining and Metals (ICMM). Mining: Partnerships for Development TOOLKIT. Third edition. 2018. Available at: http://www.icmm.com/mpd [Accessed on 06/07/2018].
EU Principles for Sustainable RMs
 The Raw Materials Supply Group (RMSG including Member States, regional authorities, industry associations, civil society, social partners and research organisations), led by DG GROW, and the European Commission have developed and agreed upon a set of voluntary, non-mandatory EU principles for sustainable raw materials.
The objective of the EU principles for sustainable raw materials, is to align the understanding of sustainable raw materials extraction (from exploration to post-closure) and processing operations in the EU amongst Member States and define the general direction towards the SDGs. This will lead to a common European understanding on sustainability principles that can contribute to coherence amongst emerging certification and labelling schemes, and that existing practices, codes and standards are recognised.
The principles should enable to better communicate with the public on the conditions under which sustainable raw materials extraction and processing takes place in Europe and increase public acceptance for this activity.
Additional information can be found in the dedicated report.