
Strategic sectors and technologies value chains and CRM demand
The European Commission has published analyses of value chains and demand forecasts for critical raw materials in strategic sectors and for selected technologies. (2020, 2023)
The Supply chain analysis and material demand forecast in strategic technologies and sectors in the EU – A foresight study analyses the five most relevant industrial sectors of the EU economy, (renewables, e-mobility, energy industry, ICT, and aerospace & defence) within fifteen technologies.
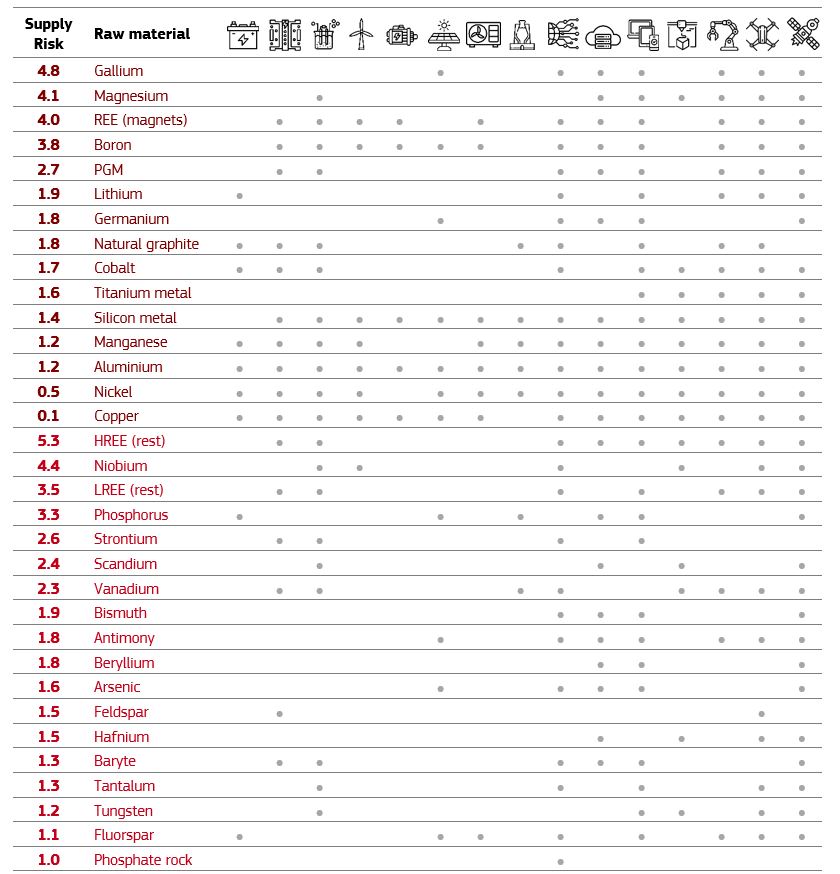
The study considers the 87 candidate raw materials assessed in the Criticality Assessment exercise 2023 (EC, 2023). Raw materials are divided into three categories: strategic (25), critical (25) and NFNF-critical (37). Within each category, materials are reported in descending order of Supply Risk as calculated in EC, 2023.The table shows the technologies in which the raw materials are utilised. The most widely used raw materials are aluminium (in all 15 technologies), copper, nickel, silicon metal (14), and manganese (13).
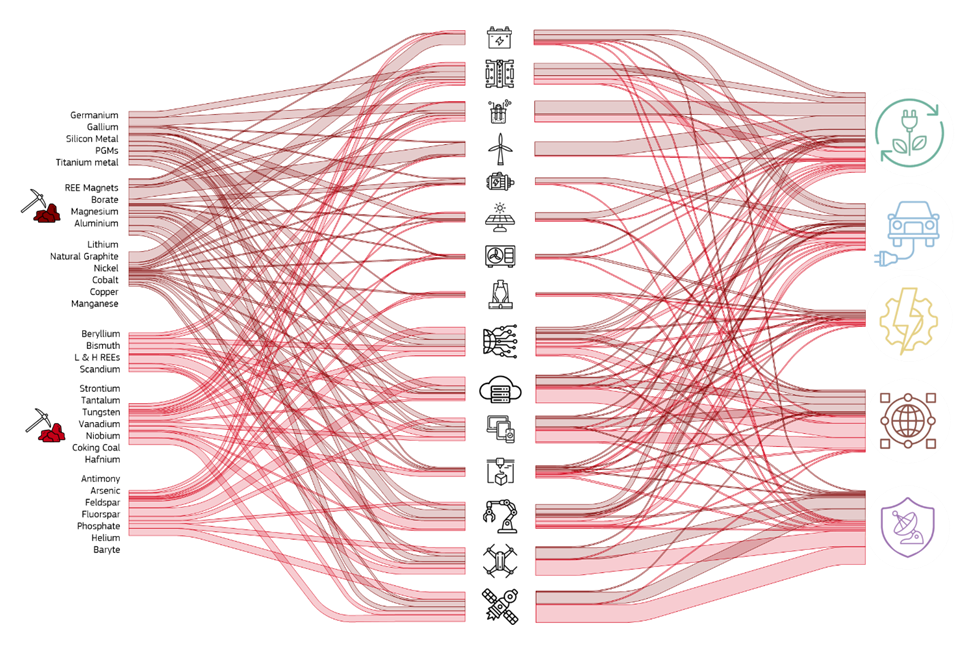
The arrows are coloured with three different colours, corresponding to the colours of the criticality of the materials (critical = bright red and strategic = dark red). The thickness of the arrow represents the proportion of each type of raw material. The thickness of the arrows that flow from the left column (raw material) to the left of the middle column (technologies) represents the proportion of raw material needed in a technology. The thickness of the arrows in the final column represents the proportion of the raw material used by each sector, e.g., solar PV contributes to renewables, ICT, and aerospace and defence sectors. The sum of all contributions is constrained to sum the same as the left column.
Supply risks for the EU
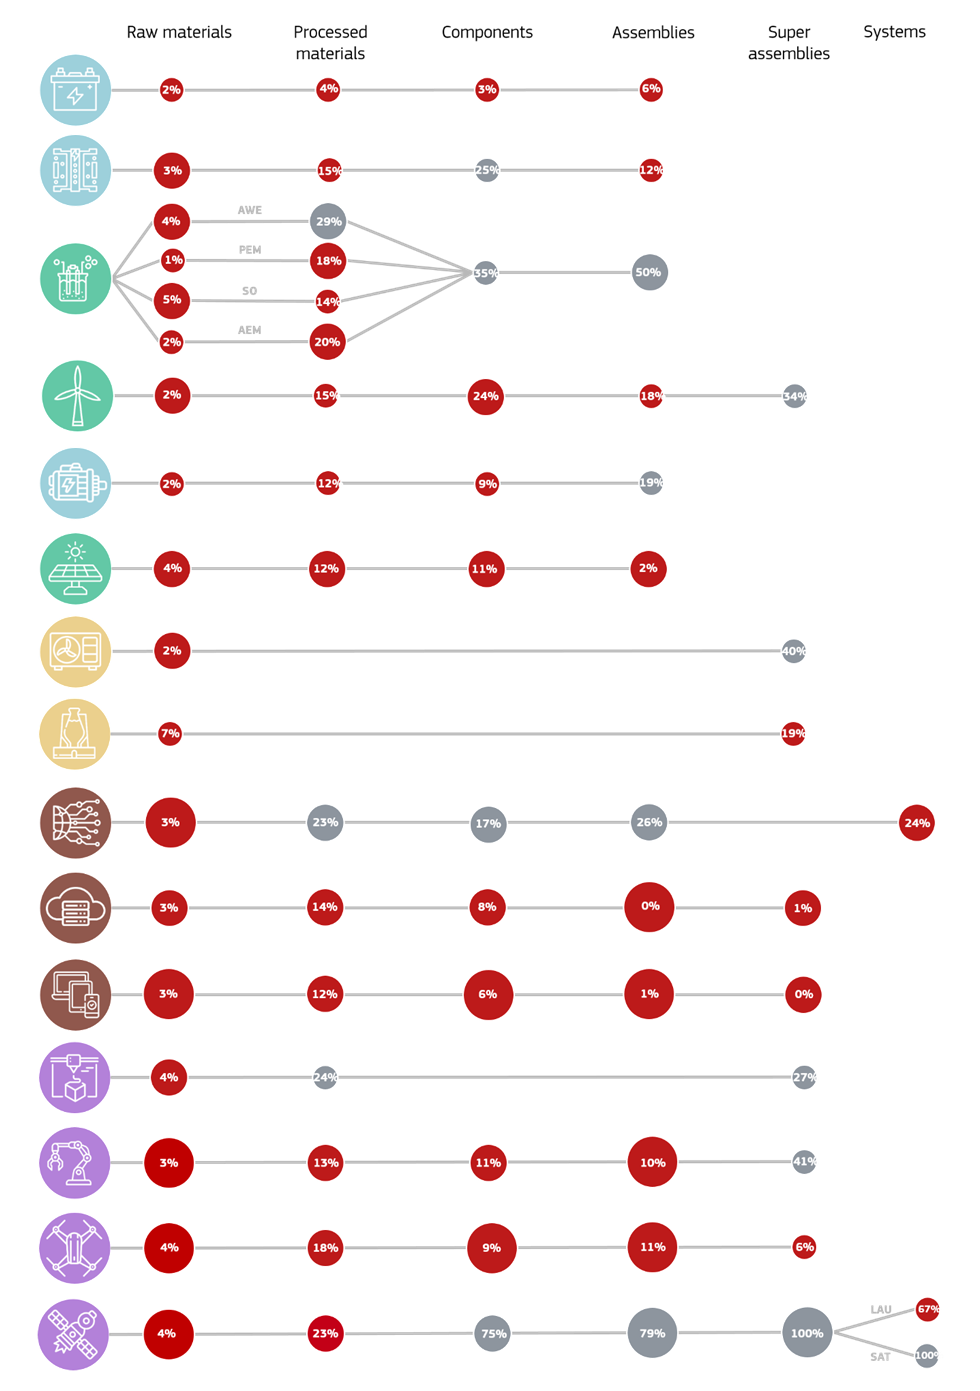
The graph bellow presents the steps characterised by vulnerability (red bubble) and those which are the least vulnerable (grey bubble). The bubbles also report the average EU share in global production for the relevant supply chain step.
Overall, the EU shows significant vulnerability along the supply chains examined: only 17 bubbles are grey out of a total of 70. Thus, 53 supply chain steps are considered to be critical. However, a general pattern can be identified in the graph. On the one hand, the raw materials step is systematically critical for all technologies. Here, the EU share in global production is never higher than 7%. Additionally, five technologies (i.e. batteries; solar PV; data storage and servers; smartphones, tablets and laptops; and drones) show vulnerability along the entire supply chain, thus highlighting the EU’s dependency in the case of final products too.
On the other hand, the EU’s vulnerability tends to diminish along the supply chain. In the last step of the chain (the final product, i.e. assemblies, super-assemblies, or systems), there are almost as many cases of NFNF-vulnerability as there are of vulnerability. The EU is therefore reasonably strong in the manufacturing of the final technologies.
Demand forecast analysis
Meeting the EU’s ambitious policy targets will drive an unprecedented increase in materials demand in the run up to 2030 and 2050. This report develops material demand scenarios, based on policy-relevant scenarios and market trends, with the aim of quantitatively assessing future material needs in each selected technology.
The figure below summarises the main results of the demand forecast analysis, showing the future patterns of the materials which are characterised by the highest growth relative to current global supply, alongside some additional strategic materials.
These estimates refer to the High Demand Scenario (HDS), which assumes rapid technology deployment and a combination of market shares and material intensities which result in a sharp increase of materials demand. The Low Demand Scenario (LDS), considers a slow technology deployment and combinations of market shares and material intensities.

For further info on criticality, please visit:
https://single-market-economy.ec.europa.eu/sectors/raw-materials/areas-specific-interest/critical-raw-materials_en
Latest update: 16/03/2023